In Google Analytics 4, conversion rate is a primary metric which measures the number of users who complete a particular action against the total number of visits. It acts as a report for your website or app’s effort in getting people to do what you want them to do – be it making purchases, signing up for newsletters or filling out forms. Conversion rates show us what works and what doesn’t; whether from Google Ads or other search engines. This enables businesses make better decisions on how they can enhance user experience hence achieve more success online through adding new metrics into their reports.
What’s the Difference between GA4 Conversion (Key Event) and Conversion Rate (Key Event Rate)?
GA4 conversion varies in its focus and measurement from conversion rate. In GA4, conversion indicates any activity that a user may want to accomplish like buying or filling out a form.
From now:
GA4 Conversion called Key Event
Conversion Rate called Key Event Rate
Conversion rate on the other hand measures what percentage of users who complete a specific action out of all sessions recorded. Conversion reflects individual actions while conversion rate shows wider view of efficiency by considering user engagement per session. For example, a purchase made through Google Ads can be treated as the event but then how many such purchases occurred relative to total number of sessions from all traffic sources would be indicated by conversion rate. Knowing this difference is essential for optimizing strategies and gaining insights into user behavior as well as website performance.
How to Track CT in GA4
Discover how to track Click-to-Call (CTC) events in Google Analytics 4 (GA4) using Google Tag Manager (GTM). Follow these steps to see how people interact with your website and improve your chances of turning visitors into customers.
Set Up GTM Variables
GTM uses variables to hold values when certain actions happen on your site. To set up variables:
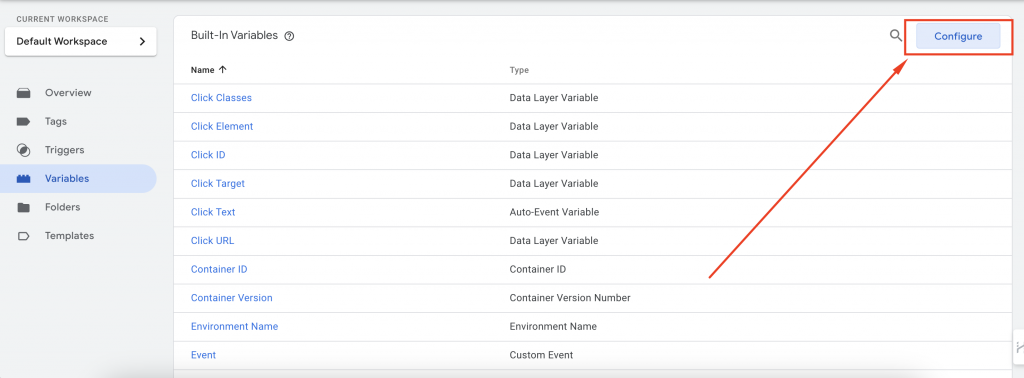
- Go to the Variables tab in GTM.
- Click Configure under built-in variables.
- Make sure all checkboxes under Clicks are checked.
Create a CTC Trigger
Let’s set up a trigger to track when users click to call:
- Find the event name:
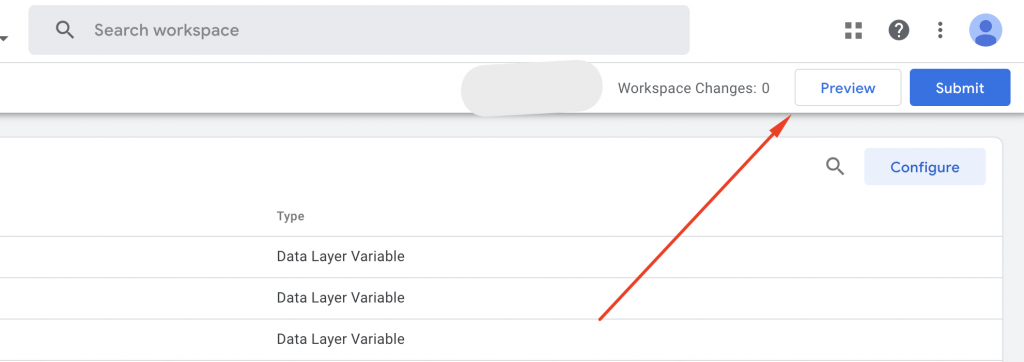
- Use GTM’s Preview mode.
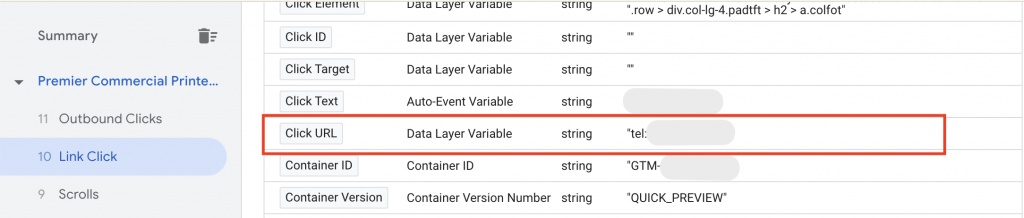
- Click your phone number or icon.
- In the debug mode, you’ll see an event name (e.g., {event: “gtm.linkClick”, …}) when the call action happens.
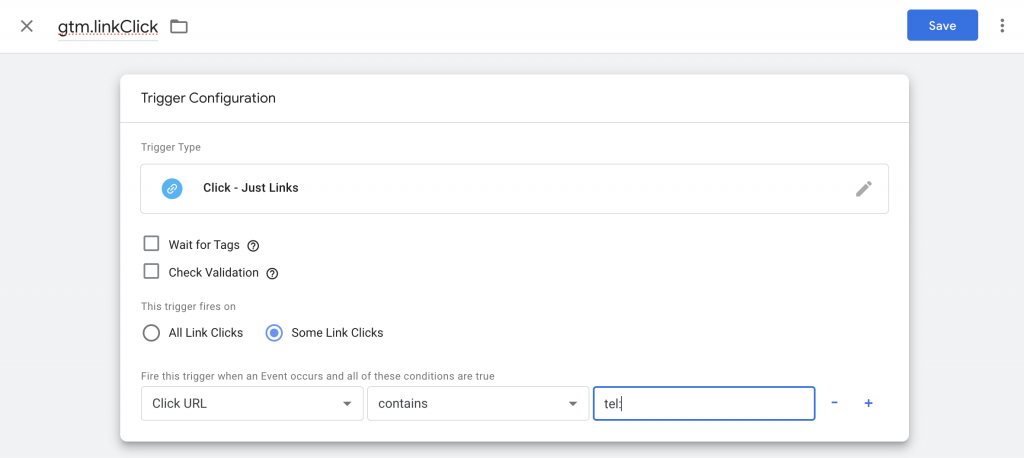
Set up the trigger
- Go to Triggers + New in GTM.
- Name your trigger (e.g., ‘Click to Call’).
- Configure it to fire when:
- Event name is gtm.linkClick.
- Click URL contains tel: (common for CTC).
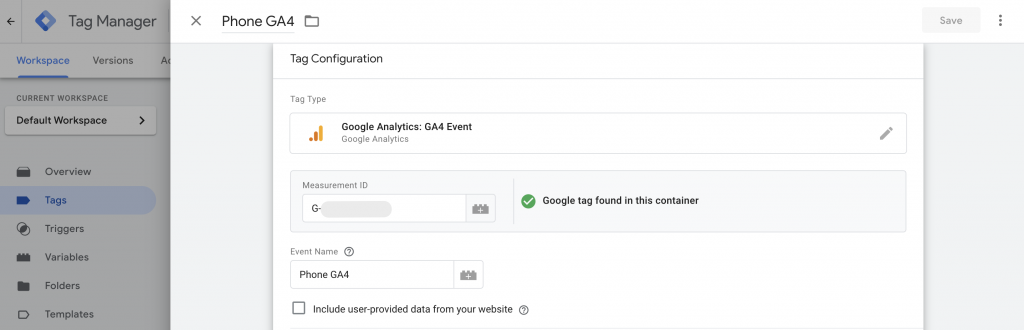
Set up the tags
- Go to Tags + New in GTM.
- Name your tags (e.g., ‘Click to Call’).
- Configure it to fire when
- Event name is gtm.linkClick.
- Click URL contains tel: (common for CTC).
- Add Trigger
Testing and Publishing
- Preview to test the trigger.
- Once satisfied, publish the changes in GTM.
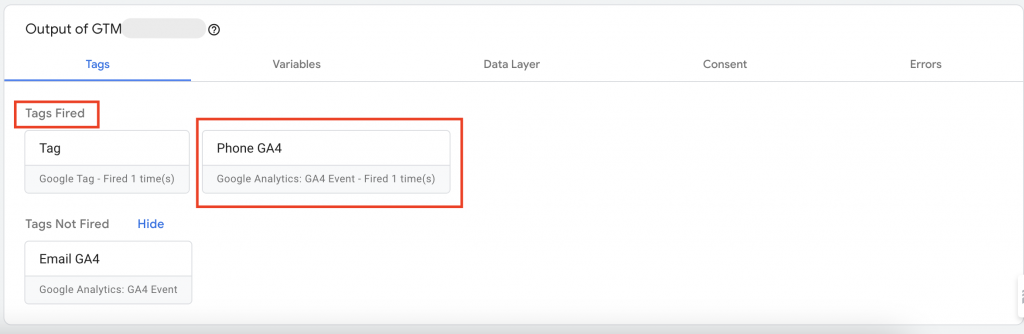
By doing this, you’ll track CTC events and understand how users engage with your business, enhancing user experience and potentially boosting conversions. This seamless connection with your audience is vital in today’s digital landscape.
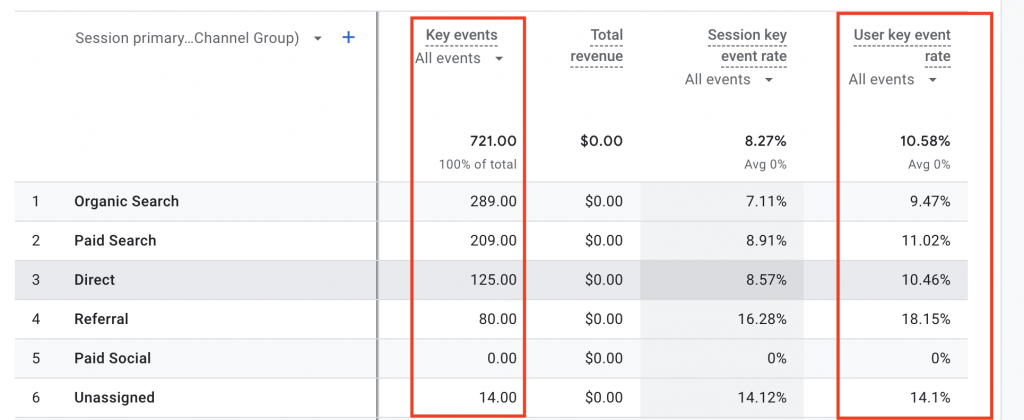
Two Types of Conversion Rate in Google Analytics 4
In Google Analytics 4 (GA4), there are two main types of conversion rates: session conversion rate and user conversion rate.
Session Conversion Rate
Session conversion rate in Google Analytics is a crucial metric that reflects the effectiveness of your website in encouraging users to complete a desired action during their visit. This desired action, known as a conversion, can vary depending on the goals of your website. For example, conversions might include making a purchase, filling out a contact form, subscribing to a newsletter, or downloading a resource. The session conversion rate specifically measures the percentage of visits (or sessions) during which these conversions occur. This metric is vital for understanding how well your website engages visitors and guides them toward taking meaningful actions.
Why is Session Conversion Rate Important?
The session conversion rate is more than just a number; it provides insight into the user experience on your site. A high session conversion rate typically indicates that your website is well-optimized, with clear calls to action, engaging content, and a seamless user journey. Conversely, a low session conversion rate may suggest that there are barriers preventing users from completing desired actions, such as confusing navigation, slow page load times, or an unappealing design. By monitoring and analyzing session conversion rates, marketers can identify problem areas on their website and make data-driven decisions to enhance user engagement and increase conversions.
How to Analyze Session Conversion Rate?
To effectively analyze your session conversion rate, it’s essential to look beyond the surface numbers and consider various factors that might influence user behavior. Here are some steps to help you dive deeper into your session conversion rate analysis:
- Identify Key Conversion Points: Determine the specific actions you want users to take on your site, such as purchasing a product or signing up for a newsletter. Make sure these points are clearly defined in your Google Analytics setup.
- Evaluate Traffic Sources: Analyze the sources of your website traffic (e.g., organic search, paid ads, social media) to see which channels are driving the most conversions. This can help you allocate your marketing budget more effectively.
- Examine User Journey: Track the paths users take on your site leading up to a conversion. Identify any patterns or common exit points where users might be dropping off before completing a desired action.
- Review Page Performance: Look at individual page performance, especially those that are crucial to the conversion process, such as product pages or checkout pages. High drop-off rates on these pages may indicate issues that need to be addressed.
- Consider User Segments: Segment your audience based on different criteria, such as location, device type, or user behavior. This allows you to tailor your marketing strategies to specific groups that might have different needs or preferences.
- Avoid Double-Counting Short Sessions: Be cautious about counting sessions that last less than three seconds, as these might not provide meaningful engagement data. Filtering out such sessions can give you a more accurate representation of your session conversion rate.
Improving Your Session Conversion Rate
Once you’ve identified areas for improvement, it’s important to implement strategies that can enhance your session conversion rate. Here are some effective tactics:
- Optimize Landing Pages: Ensure that your landing pages are aligned with the intent of your visitors. Use compelling headlines, clear calls to action, and relevant content to engage users from the moment they arrive on your site.
- Enhance User Experience (UX): Improve the overall usability of your website by making it easy for users to navigate, find information, and complete actions. This includes optimizing page load times, ensuring mobile-friendliness, and simplifying the checkout process.
- Personalize Content: Tailor your content and offers to different user segments based on their behavior, preferences, and demographics. Personalization can increase relevance and drive higher engagement and conversions.
- Test and Iterate: Use A/B testing to experiment with different versions of your webpages, forms, or calls to action. Continuously test and refine your site elements based on data-driven insights to find the most effective combinations.
By focusing on these areas, businesses can improve their session conversion rate, ultimately leading to higher overall conversions and better return on investment (ROI) from their marketing efforts.
User Conversion Rate
Analyzing user conversion rates is a critical process that allows businesses to understand how well their website and marketing efforts are performing in turning visitors into customers. The user conversion rate represents the percentage of total users who complete a specific desired action on your website within a given time frame. These desired actions can vary depending on the goals of your business, such as making a purchase, signing up for a newsletter, filling out a contact form, or downloading a resource. By closely monitoring and analyzing this metric, businesses can gain valuable insights into their overall effectiveness in engaging visitors and driving conversions.
Why Analyzing User Conversion Rates Matters
Understanding user conversion rates is essential for evaluating the success of your marketing strategies. A high user conversion rate typically indicates that your website is well-optimized, with a user-friendly design, relevant content, and effective calls to action. Conversely, a low conversion rate might suggest that there are barriers preventing users from completing desired actions, such as confusing navigation, lack of trust signals, or poor user experience. By analyzing user conversion rates, businesses can identify these issues and implement changes to improve their website’s performance and increase conversions.
Steps to Analyze User Conversion Rates
To effectively analyze user conversion rates, businesses should take a systematic approach that considers various factors influencing user behavior. Here’s a step-by-step guide to help you get started:
- Set Clear Conversion Goals: Begin by defining the specific actions you want users to take on your website. These could be making a purchase, signing up for a newsletter, filling out a form, or any other action that contributes to your business objectives.
- Utilize Google Analytics: Use Google Analytics to track user conversion rates over time. This tool provides detailed reports on user behavior, allowing you to monitor conversion rates and identify trends.
- Segment Your Audience: Break down your audience into different segments based on factors like demographics, traffic sources, device types, or user behavior. Analyzing conversion rates for each segment can help you tailor your marketing strategies to different groups.
- Compare with Other Metrics: To get a comprehensive understanding of your website’s performance, compare user conversion rates with other key metrics such as organic search traffic, eCommerce conversion rates, and overall conversion data. This comparison can reveal how different traffic sources and user segments contribute to your conversions.
- Identify Trends and Patterns: Look for patterns in your conversion data, such as seasonal trends, day-of-week performance, or changes in user behavior after marketing campaigns. Identifying these trends can help you optimize your marketing efforts and improve conversion rates.
- Test and Optimize: Based on your analysis, implement changes to your website or marketing strategies to enhance user experience and increase conversions. Continuously test these changes using A/B testing or other methods to determine what works best.
Benefits of Analyzing User Conversion Rates
By regularly analyzing user conversion rates, businesses can:
- Optimize Marketing Strategies: Gain insights into which marketing channels and campaigns are most effective at driving conversions, allowing you to allocate resources more efficiently.
- Improve Website Performance: Identify and fix issues on your website that may be hindering conversions, such as slow loading times, unclear navigation, or poor mobile responsiveness.
- Enhance User Experience: Tailor your website content and design to better meet the needs and expectations of your users, leading to higher engagement and conversion rates.
- Increase ROI: By improving conversion rates, businesses can increase their return on investment (ROI) from marketing efforts, driving more revenue with the same or lower costs.
Analyzing user conversion rates is an ongoing process that requires continuous monitoring and optimization. By taking a data-driven approach, businesses can make informed decisions that lead to improved performance, better user experience, and higher conversions.
Analyzing User Conversion Rate Metrics and Conversion Events
When analyzing user conversion rate metrics, it’s essential to focus on understanding how effectively your website converts visitors into customers or leads. The user conversion rate refers to the percentage of unique users who complete a desired action, such as making a purchase or signing up for a service, within a specified time frame. This metric is critical in evaluating your website’s overall performance in engaging users and driving them toward conversion events.
The Role of Conversion Events in Measuring Success
A conversion event represents any specific action that you want users to complete on your website. These actions could range from making a purchase to filling out a contact form or subscribing to a newsletter. Conversion events are the cornerstone of understanding how users interact with your site, as they provide direct insight into what actions are most valuable for your business.
In Google Analytics 4 (GA4), conversion events are tracked to measure the conversion rate in GA4. This conversion rate reflects the proportion of conversion events relative to the total number of user interactions. By analyzing this data, businesses can identify which events are driving the most value and optimize their strategies accordingly.
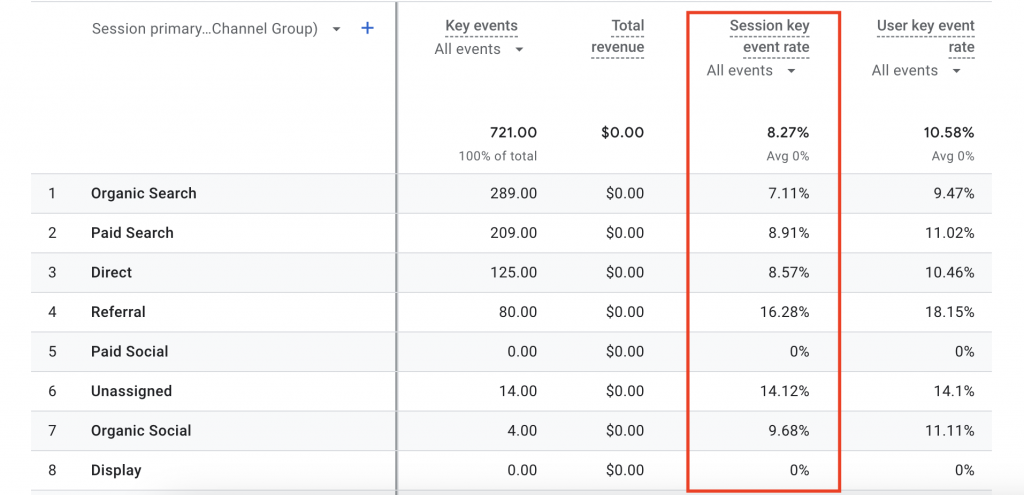
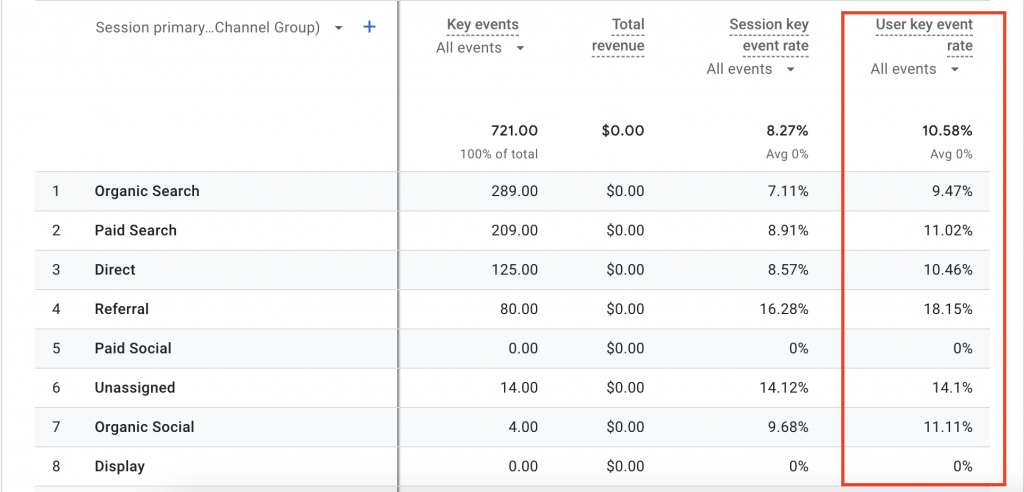
Understanding the Traffic Acquisition Report
The traffic acquisition report in GA4 plays a crucial role in understanding where your website traffic is coming from and how different sources contribute to your overall conversion rate. By examining the traffic acquisition report, you can identify which channels, such as organic search, paid advertising, or social media, are driving the most conversion events. This insight allows you to allocate resources more effectively and focus on the channels that yield the highest user conversion rates.
Additionally, the traffic acquisition report helps you understand the effectiveness of your marketing campaigns by comparing the performance of different traffic sources. For instance, if one source consistently leads to more conversion events, you might decide to invest more in that channel to boost your overall conversion rate.
Session Conversion Rate Metric vs. User Conversion Rate
When analyzing conversion rates, it’s important to distinguish between the session conversion rate metric and the user conversion rate. The session conversion rate metric measures the percentage of sessions in which a conversion event occurs, while the user conversion rate measures the percentage of unique users who complete a conversion event over a specified period.
Both metrics offer valuable insights, but they serve different purposes. The session conversion rate metric is ideal for evaluating the immediate impact of your website’s content and user experience within a single visit. In contrast, the user conversion rate provides a broader view of user behavior, focusing on the overall effectiveness of your website in converting visitors into customers over time.
Comparing GA4 to Universal Analytics
In the shift from Universal Analytics to GA4, the approach to tracking conversion events and analyzing conversion rates has evolved. In Universal Analytics, conversions were often tied to goals or eCommerce transactions. However, GA4 introduces a more flexible and event-driven model where any interaction can be designated as a conversion event.
This change allows for more granular tracking and better insights into user behavior, as businesses can now define conversion events that align more closely with their specific goals. The conversion rate in GA4, therefore, provides a more nuanced understanding of how users interact with your site and complete desired actions.
Optimizing Conversion Events and Conversion Rates
To optimize your conversion events and improve your conversion rate, consider the following steps:
- Define Clear Conversion Events: Identify the key actions you want users to take on your website and set them as conversion events in GA4. This could include purchases, form submissions, or downloads.
- Utilize the Traffic Acquisition Report: Regularly review the traffic acquisition report to understand which channels are driving the most conversion events. Focus your marketing efforts on the channels with the highest user conversion rates.
- Compare Metrics: Analyze both the session conversion rate metric and the user conversion rate to get a comprehensive view of your website’s performance. Use these insights to refine your content and user experience.
- Leverage GA4’s Flexibility: Take advantage of GA4’s event-driven model to track a wide range of interactions. This will help you better understand how different actions contribute to your overall conversion rate.
By focusing on these strategies, businesses can enhance their understanding of conversion events, optimize their conversion rates, and make data-driven decisions to improve overall performance.
GA4 Conversion Rate Reports
Here are the steps to calculate your conversion rate in Google Analytics 4:
- Start by creating a new report in Google Data Studio and connecting your GA4 data source.
- Once your data source is connected, add a scorecard to your report and change the metric to ‘Conversions’.
- By default, this will display the total number of conversions. However, if you want to focus on a specific conversion action, you can add a filter. To do this, head to the ‘Conversions’ report in Google Analytics to identify the available conversion events.
- If the desired conversion action is not available, you’ll need to set it up first. Watch tutorials or guides on Google Analytics 4 Conversion Tracking for assistance.
- For example, if you want to calculate the conversion rate using the ‘begin_checkout’ action, add a filter in Google Data Studio for this specific conversion action.
- Once the filter is applied, you’ll see the total number of conversions for the selected action.
- Next, add another scorecard to the report and change the metric to either ‘Sessions’ or ‘Total Users’, depending on whether you want to calculate a session-based or user-based conversion rate.
- Combine the two metrics to calculate your conversion rate by selecting both scorecards, right-clicking, and selecting ‘Blend Data’.
- A new scorecard displaying your conversion rate will be added to the report.
- That’s it! You’ve successfully calculated the conversion rate using data from Google Analytics 4 with the help of Google Data Studio.
How can conversion rate metrics can optimize your online business?
To upgrade your online business, it is essential to utilize metrics for conversion rate. For example session conversion rates, ecommerce conversion rates, and tools such as Google Analytics can be used to measure conversion. This enables you to realize the way in which individuals are using your site. You will be able to recognize where visitors come from like search engines among others and what actions bring about purchase thus enabling you concentrate on what works best.
By tracking how many people visit your site and how many of them take action, you can know if your marketing strategy is effective or not and also determine the ease of use of your website. Sometimes even small changes like improving page titles or making forms easier to fill out may lead to more sales on the website because more people will buy things there. Therefore efforts should be directed towards conversion rate optimization so that they count and yield better results for an online business.
Conversion rate for e-commerce
Recent research has shown that simple changes to an e-commerce site design can significantly improve sales by increasing the conversion rate. Just a 1% increase in this indicator means much more money in your pocket. Most e-commerce sites have a conversion rate of between 2% and 4%, but some top performers achieve 5% or even higher.
The findings indicate that where you get your website traffic from makes a difference; people who arrive at your site through organic searches are likelier to make purchases than those coming from ads or social media platforms. Additionally, certain actions on your website often lead to more transactions such as adding items into the shopping cart or completing checkout process.
To increase e-commerce conversion rates on your online store make small adjustments like improving page titles, streamlining checkouts, and refining product descriptions for clarity. With tools such as Google Analytics which helps track user behaviour so that informed decisions can be made towards bettering performance leading not only to increased sales but also improved return on investment (ROI).
Summary
The guide gives useful advice on how to improve conversion rates using Google Analytics 4 (GA4). It shows ways of monitoring various conversions such as Click-to-Call events through Google Tag Manager. With session and user conversion rates, enterprises can evaluate their website performance and enhance user interactions. Businesses need to understand these conversion rate indicators especially event conversion rates so that they can gain insights for decision making towards bettering their online visibility which in turn leads into more conversions.